
A-Level, AS and T Level Results Day 2026
Published 13th August 2026
As an ex-teacher, headteacher, and parent who has been through this three times with my own children, I can almost feel the nervous energy and excitement that will be felt by students, their teachers, and parents across the country as the A Level and Technical Level 3 qualification results were published today.
There will be some amazing results and the corresponding joy that comes with them; huge congratulations to all young people who receive the results they anticipated and begin planning the next stage of their personal journeys. Remember to take time to breathe, learn from the experience (the highs and lows along the way), and be sure to savour the results of your hard work.
If the results have not landed as planned, there will be inevitable disappointment. There are people around you who are prepared and qualified to help; take all the advice available, remember this is but a moment in time, and learn from the process. Some of the most successful people around have been in your shoes. This too shall pass.
And so, to the brief results analysis.
We are in an unusual demographic position at the moment, with primary pupil numbers falling dramatically, while Level 3 results continue to grow as a result of increased student numbers. 2026 saw a 2.4% rise in the overall number of students taking A levels.
Top grades increased across all subjects, with both male and female students improving the percentage achieving A* grades. Male students recorded a significant 0.5% increase in the percentage achieving A*/A grades, while female students showed only a marginal drop from last year.
After significant year-on-year falls in pupil entries until 2024, the number of entries in D&T has risen for the second successive year (10,874 this year compared with 10,576 in 2025).
D&T Results breakdown
- The percentage of students achieving A* in D&T rose slightly from 5.8% to 5.9%
- A* to A grades in the subject remained steady at 19.3% of entries, as it was last year.
- A* to B Grades rose from 45.4% last year to 46.1% this year.
- A* to C rose significantly from 71.9% last year to 74.1% this year.
The data suggests the subject may have settled into a new ‘norm’ at A*, with recent figures ranging from 5.6% to 6.0%. This appears to have stabilised following a significant rise attributable to COVID from 2020 to 2022.
The same can be said of the A* to A percentage, which appears to have steadied around this year’s 19.3%
A* to B also appears to have settled, although there is definitely some growth here, with this year’s percentage at 46.1% being the highest since 2022.
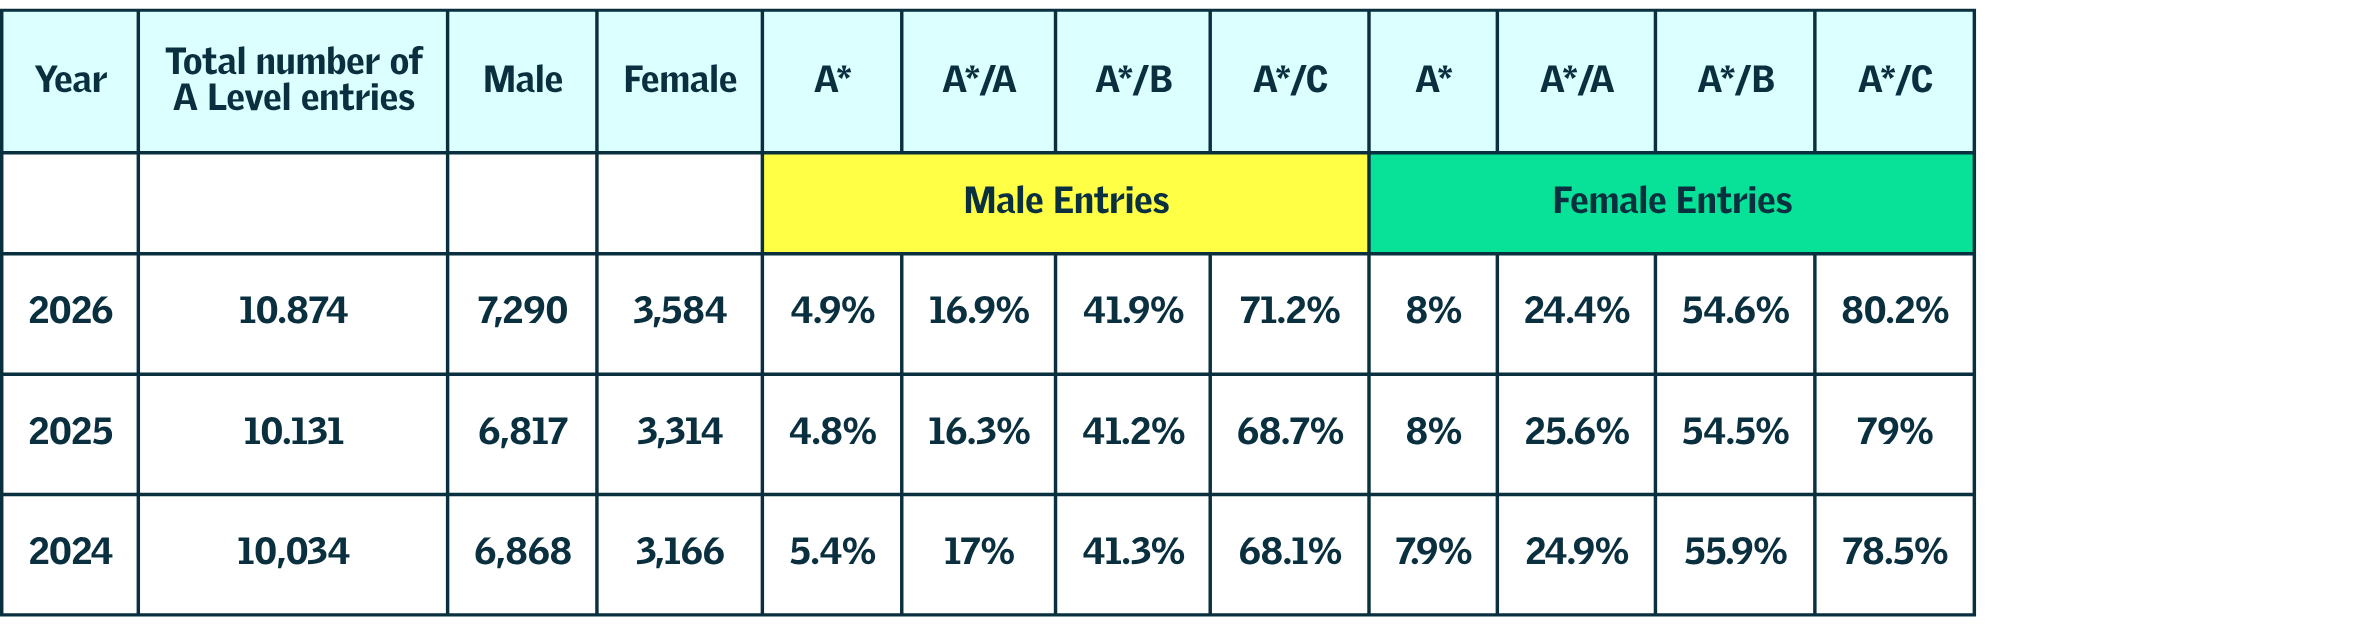
Design and Technology entries overall were up 840 since 2024, a rise of 8.37%, which is significant.
Over the same period, the number of male entries has risen by 422 (a 6.14% increase), and female entries have risen by 418 (a 13.2% increase in female subject entries).
The chart below maps entries and key grades over the last three years:
Vocational Results
This is the first year that JCQ has published technical and vocational results alongside A Level results; we welcome the transparency and accountability that this will bring.
T Levels
This is the fifth year T Levels have been awarded. This year, 19,665 students are receiving their overall results, compared with 11,909 on results day in 2025. Definite growth, though still very slow at this stage. 92.6% of students taking T Levels have achieved a pass or above.
Key results are shown below: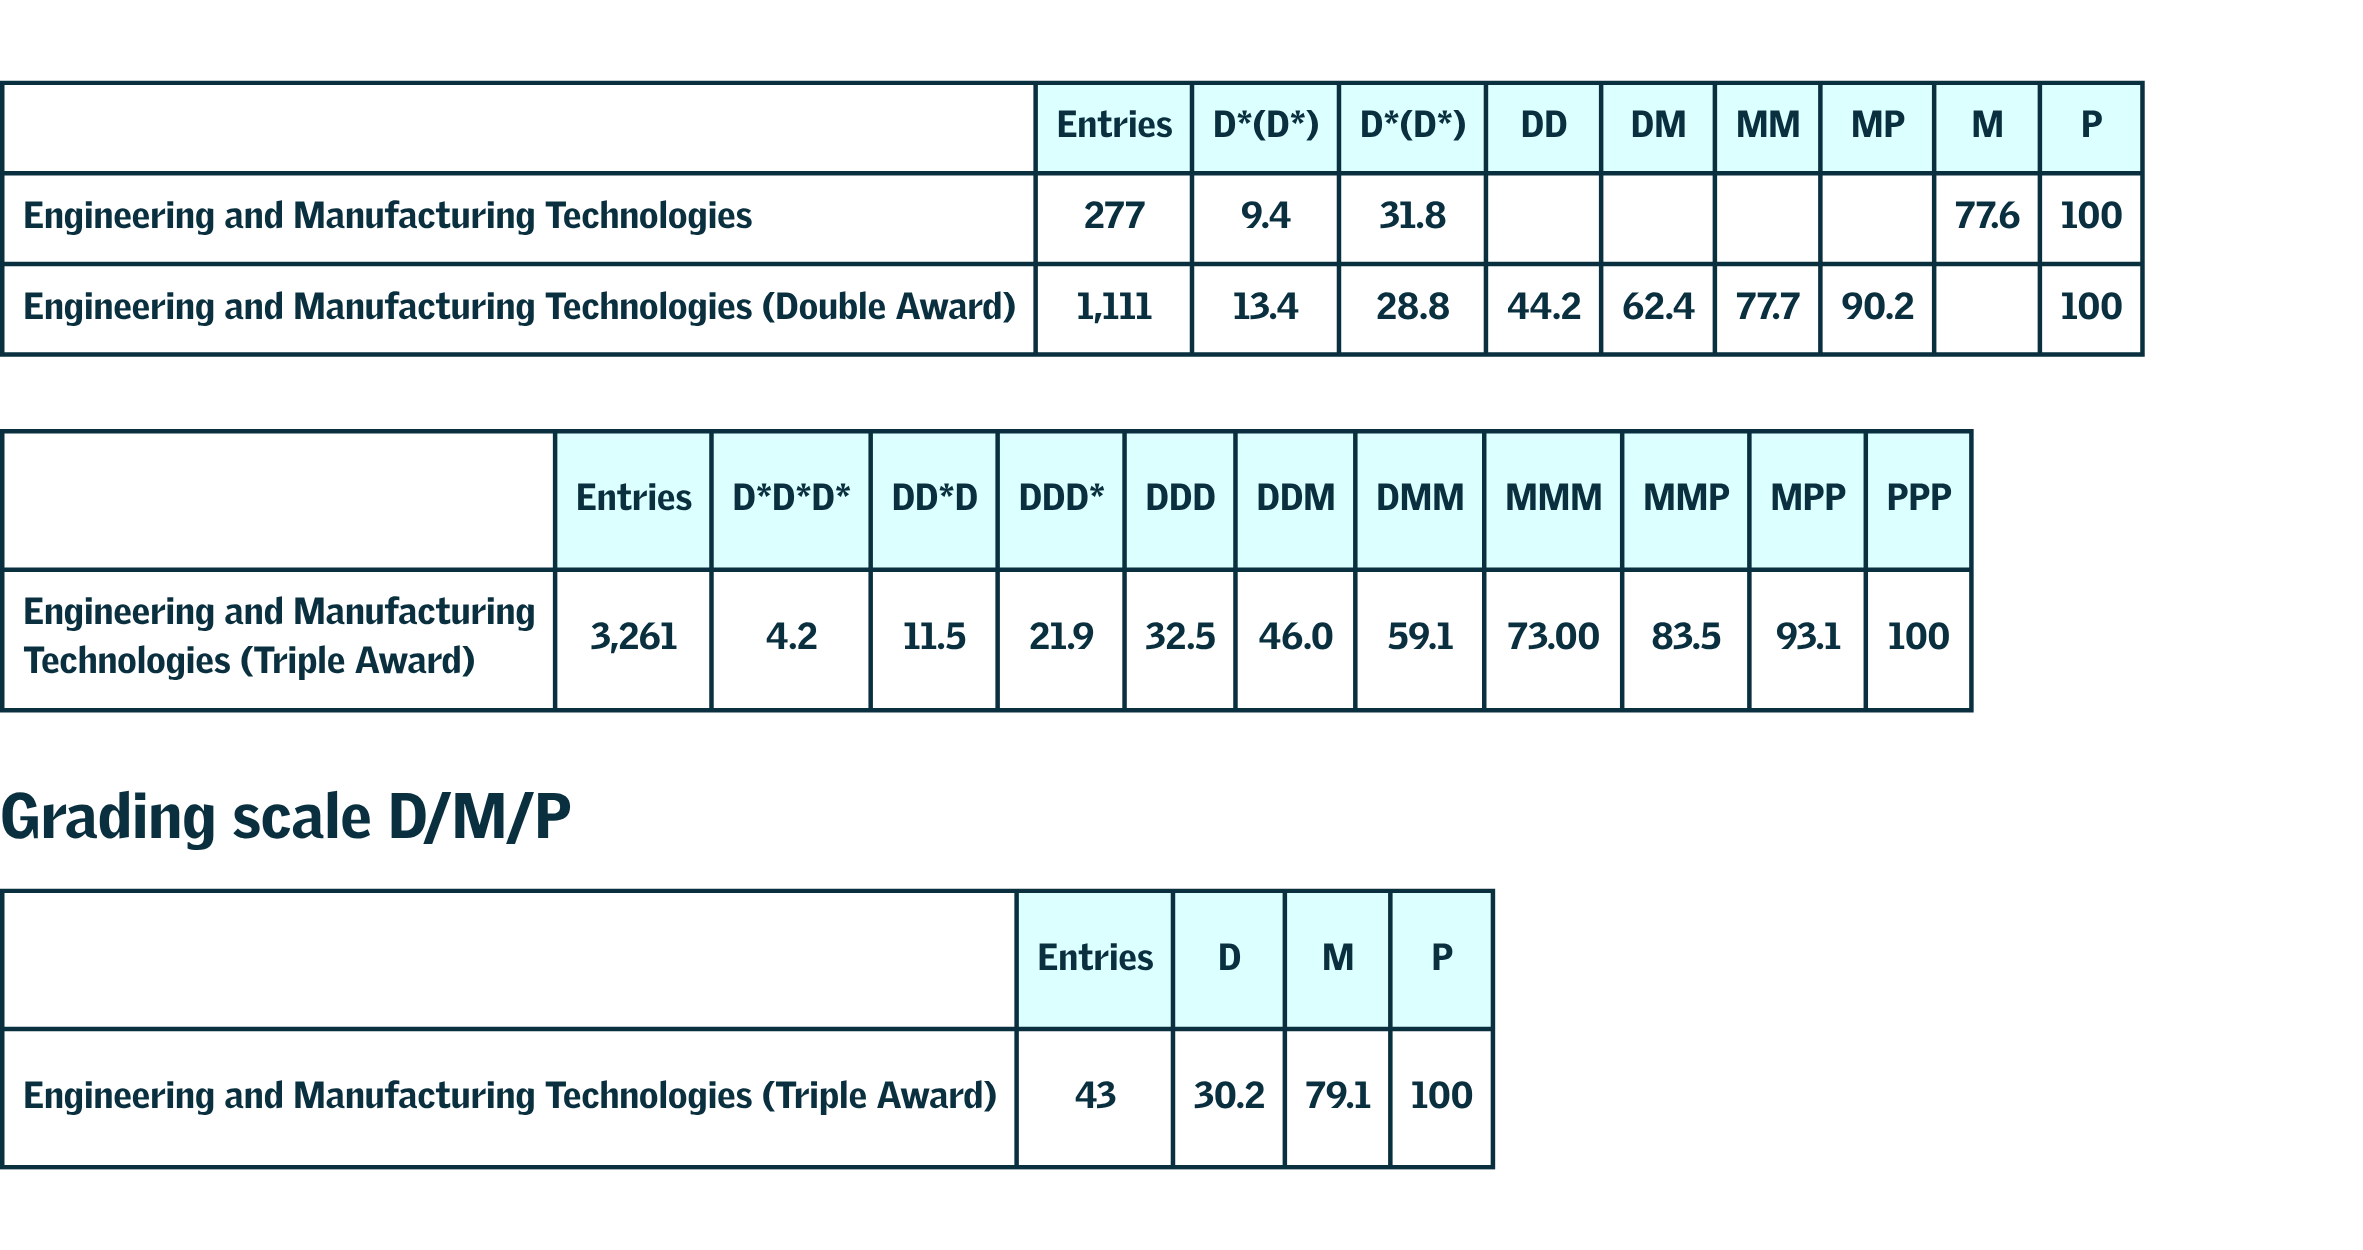 Congratulations to all students receiving results today, and a big shout-out to all the teachers who helped make this very pleasing set of results possible.
Tony Ryan
Chief Executive Officer
Design & Technology Association


